Top AI Tools Every Data Analyst Should Actually Know in 2026
DATA-6 Analyst Productivity Stack six AI tools mapped to six workflow stages, with the honest limitations and a five-step AI-assisted EDA workflow for India 2026.
Mrityunjay Pandey
· 10 July 2026 ·17 min read
Share:
Contents
Direct Answer:
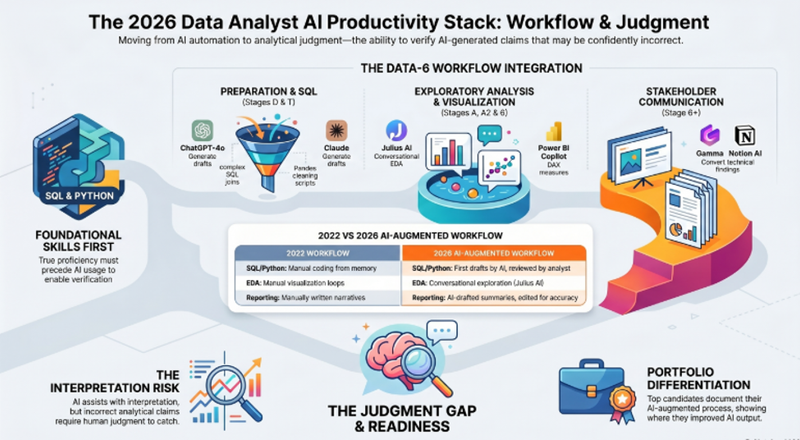
The AI tools that genuinely change how Data Analysts work in 2026 are ChatGPT-4o and Claude for SQL and Python code generation, GitHub Copilot for analysis script development, Microsoft Copilot inside Power BI for DAX and report narration, Tableau AI for natural language queries and automated insights, and Julius AI for conversational exploratory analysis and each one is most valuable at a specific stage of the analysis workflow, not as a general productivity tool you open at random.
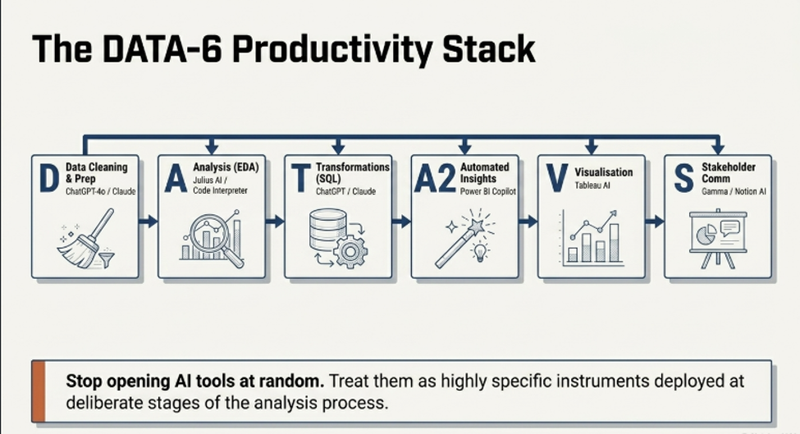
A six-stage horizontal workflow pipeline visual showing the DATA-6 Analyst Productivity Stack — Stage D (Data Cleaning: ChatGPT-4o/Claude logos, "Pandas code generation from natural language," example prompt shown), Stage A (EDA: Julius AI/ChatGPT Code Interpreter logos, "Conversational dataset exploration," example output shown), Stage T (SQL Transformations: ChatGPT/Claude logos, "Multi-table query drafts with schema context," example query shown), Stage A2 (Automated Insights: Microsoft Copilot/Power BI logo, "DAX generation and report narration"), Stage 6 (Visualisation: Tableau AI logo, "Natural language chart queries"), Stage (Communication: Gamma/Notion AI logos, "Stakeholder deck generation"). Each stage shows both the AI tool's function and a callout: "Your judgment still required for: [specific element]." Itdaksh Education branding at the bottom.
Most “top AI tools for Data Analysts” articles give you a feature list and a screenshot. This guide gives you something more useful: where in your actual work each tool creates leverage, what it genuinely automates versus what still requires your analytical judgment, and which tools are worth learning before your first Data Analyst role in India versus which ones you will encounter on the job.
Introduction: Why AI Tools for Data Analysts Are Different from AI Tools for Developers
Before getting into the specific tools, a distinction that changes how you evaluate and use all of them is worth establishing. AI tools for developers primarily assist with code generation writing functions, completing syntax, suggesting libraries. The developer’s job is to evaluate whether the code is correct and integrates properly with the existing system.
AI tools for Data Analysts are partially the same (code generation for Python and SQL) but have an additional and more consequential dimension: they assist with interpretation. A tool that summarises a Power BI report, suggests what an unusual data pattern might mean, or recommends a chart type is not just generating code. It is making analytical claims about data. And analytical claims require a level of verification that code generation does not because an incorrect SQL query will produce an error or an obviously wrong number, but an incorrectly interpreted trend can produce a plausible-sounding but wrong insight that a stakeholder will act on.
This means that using AI tools in Data Analysis requires two distinct competencies: the technical ability to use the tool effectively (prompt engineering, knowing which tool to invoke at which stage), and the analytical judgment to evaluate whether the tool’s output is correct and meaningful. The second competency is not provided by the tool. It is provided by the foundational Data Analytics skills that make the analyst capable of verification in the first place.
At Itdaksh Education, the Data Analytics programme specifically addresses this in the sequencing of its curriculum. AI tool integration is introduced in the second half of the programme after students have built genuine SQL proficiency, Python with Pandas capability, and Power BI dashboard-building skills. The sequence is deliberate: foundational skills first, AI amplification second. A Data Analyst who uses ChatGPT to generate SQL they do not understand cannot tell whether the query is logically correct. A Data Analyst who can write that query themselves uses ChatGPT to write it faster and verify it more easily.
The DATA-6 Analyst Productivity Stack A Workflow Map for AI Tool Usage
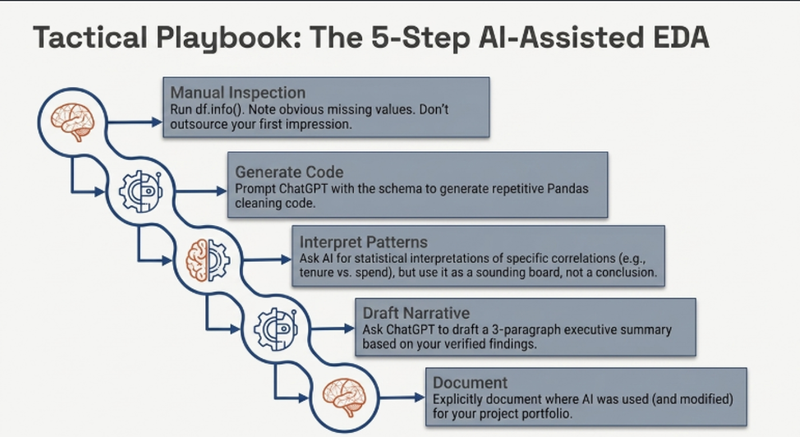
A five-step sequential workflow visual showing the AI-assisted EDA process — Step 1 (Load and inspect manually first: df.info(), df.describe(), df.head(10) — write two to three observations before opening ChatGPT), Step 2 (Generate cleaning code with ChatGPT: schema + specific cleaning requirements prompt → review code line by line before running), Step 3 (Ask for statistical interpretation of patterns: describe findings to ChatGPT, receive starting point for your own reasoning), Step 4 (Generate summary narrative: provide observations, receive first draft, revise for accuracy and domain context), Step 5 (Document AI usage in portfolio: specify where AI was used and what was changed). Each step shows a specific output and a "your responsibility" marker distinguishing AI work from analyst judgment.
(See the framework visual above)
The DATA-6 Analyst Productivity Stack maps the six stages of a Data Analyst’s typical workflow to the specific AI tools that create the most leverage at each stage. Using this map changes how you think about AI tools: not as general productivity apps you open throughout the day, but as specific instruments you reach for at specific points in the analysis process.
Stage D—Data Cleaning and Preparation
According to an IBM study on data science practitioner time allocation, analysts historically spend approximately 80% of their time on data preparation tasks cleaning missing values, handling inconsistent formats, merging datasets, removing duplicates. This is also the stage most amenable to AI-assisted code generation, because data cleaning operations in Pandas are repetitive, pattern-following, and well-represented in training data.
ChatGPT-4o and Claude are the most effective AI tools at this stage. The workflow is: describe the cleaning problem in natural language (“I have a column of dates in mixed formats including DD/MM/YYYY and YYYY-MM-DD — write Pandas code to standardise them to datetime objects”), receive a working code draft, review it, and apply it to the actual dataset. The time saving on routine cleaning operations is substantial. The critical skill the analyst must bring is the ability to review the generated code for correctness on their specific dataset’s edge cases — AI-generated cleaning code that works for the example will fail if the dataset has patterns the example did not show.
Stage A—Analysis and Exploratory Data Analysis
Exploratory Data Analysis involves generating descriptive statistics, identifying distributions, finding correlations, and spotting patterns that warrant further investigation. Julius AI (a conversational data analysis tool that allows uploading a CSV or connecting to a database and asking questions in natural language) is particularly useful at this stage. The tool performs and visualises EDA operations in response to natural language instructions, allowing the analyst to explore a new dataset conversationally before committing to a formal analysis approach.
ChatGPT-4o with Code Interpreter (Advanced Data Analysis mode) provides similar capability upload a dataset, describe what you want to explore, and receive Python code plus executed output. The distinction between Julius AI and ChatGPT’s Code Interpreter for EDA is primarily interface: Julius AI is purpose-built for data analysts and has a more persistent, session-oriented experience; ChatGPT’s Code Interpreter is more general but equally capable for dataset exploration.
Stage T—Transformations and SQL
SQL query generation is where ChatGPT-4o and Claude provide the most quantifiable time saving for Data Analysts whose primary bottleneck is query complexity. Multi-table joins with aggregations, window functions, CTEs for complex transformations, conditional aggregations with CASE statements — these are the query types that take junior analysts significant time to construct from memory. Natural language to SQL with a capable LLM produces a working first draft in seconds, and the analyst’s role shifts to reviewing and optimising the query rather than constructing it from scratch.
The critical practice for effective SQL generation with AI is providing context: the schema, the table names and column definitions, and a specific description of what the query should return. A vague prompt produces a generic query that may not match the actual database structure. A specific prompt “Write a MySQL query joining orders (order_id, customer_id, order_date, total_value) with customers (customer_id, region, tier) to find the total revenue by region and tier for Q1 2026, ordered by revenue descending” produces a query that is approximately correct and requires only minor review before execution.
Stage A2—Automated Insight Generation
Microsoft Copilot inside Power BI represents one of the most significant AI integrations in the Data Analyst’s visualisation toolkit. Copilot can generate DAX measures from natural language descriptions (a major time-saving for analysts who find DAX’s syntax counterintuitive), create narrative summaries of dashboard pages describing the key trends and anomalies visible in the charts, and answer natural language questions about the data underlying a report. For a working Data Analyst in India using Power BI daily — which describes a significant proportion of the BFSI and IT services analyst market — Power BI Copilot is now a standard workflow component rather than an advanced feature.
The honest limitation: Power BI Copilot requires Microsoft Fabric or Power BI Premium capacity, which means it is available in enterprise environments but may not be accessible in free or Pro tier accounts. For freshers practising on their own, the capability is demonstrable in the full enterprise environment but not available for self-directed study without the relevant subscription.
Stage 6—Visualisation and Dashboarding
Tableau AI (incorporating Einstein Copilot for analytics, developed through Salesforce’s Einstein platform) allows natural language queries directly against connected data sources, with Tableau generating the appropriate visualisation automatically. For analysts who know what question to ask but are not certain which chart type best communicates the answer, Tableau AI’s automated recommendation layer provides a starting point that the analyst can then refine.
The important caveat here is the same as for all AI-generated visualisations: the recommendation is based on data type and statistical pattern recognition, not on domain knowledge or the specific communication context of the analysis. A chart type that is technically appropriate for the data distribution may still be wrong for the stakeholder audience or the business context. Analytical judgment in chart selection remains the analyst’s responsibility, with AI providing the technical starting point.
Stage—Stakeholder Communication
Gamma and Notion AI are tools that operate at the communication end of the analysis workflow. Once the analysis is complete and insights are documented, these tools assist with converting the analysis findings into stakeholder-ready presentation decks and written summaries. Gamma generates structured slide decks from outline text or document uploads; Notion AI assists with writing executive summaries and structuring findings for different audiences. For analysts whose bottleneck is converting technical findings into clear business communication, these tools compress the time between completed analysis and delivered insight significantly.
Which AI Tools Are Actually Expected in Data Analyst Jobs in India in 2026
This is the practical question that most “top tools” articles do not answer specifically: which of these tools will you be expected to know when you walk into your first Data Analyst role in Thane, Mumbai, or Navi Mumbai in 2026?
Based on current job descriptions in India’s mid-market analytics hiring, the tools most frequently referenced as expected proficiencies are Power BI (including Copilot features where available), advanced Excel with AI formula assistance, SQL proficiency (with ChatGPT used to accelerate complex query writing), and Python with Pandas for data manipulation. The explicit expectation of AI tool proficiency in job descriptions is still emerging most postings list the foundational skills (SQL, Power BI, Python, Excel) and assume candidates who are strong in these will integrate AI tools naturally.
What this means practically: your priority for job readiness is not “learn all the AI tools” but “become genuinely proficient in the foundational tools, then demonstrate AI-augmented proficiency.” A portfolio project where you document your analysis process and show where you used ChatGPT to accelerate query generation and Power BI Copilot to generate narrative summaries demonstrates both the foundational skill and the AI integration which is exactly the combination employers are beginning to seek.
The Contrarian Truth About AI Tools for Data Analysts
Here is the insight that most AI tool guides for Data Analysts either miss or actively suppress because it is bad for engagement: AI tools make the gap between a strong Data Analyst and a weak one larger, not smaller. The analyst who understands their data can use AI to work significantly faster. The analyst who does not understand their data will use AI to produce incorrect insights more confidently and more quickly.
The common assumption is that AI tools are an equaliser they bring less experienced analysts up to the capability of more experienced ones. This is partially true for routine operations: AI can help a junior analyst write a query they could not construct from memory. But for the analytical judgment that separates genuinely useful analysis from technically produced-but-misleading analysis recognising when a correlation is spurious, understanding why a visualisation is misleading despite being technically correct, knowing when the data does not actually support the conclusion being drawn AI tools do not help. They may actively hinder, because AI-generated insights are stated with the same confident fluency whether they are correct or not.
The practical implication for anyone learning Data Analytics: invest heavily in building the judgment that lets you evaluate AI-generated analysis, not just the skill to invoke AI tools. Understanding statistical significance, knowing when a sample size is too small to draw the conclusion being drawn, recognising when data cleaning has introduced bias — these are the analytical skills that make AI tools safe to use rather than dangerous to trust.
Tactical Section: A Step-by-Step Workflow for AI-Assisted EDA in Python
A five-step sequential workflow visual showing the AI-assisted EDA process — Step 1 (Load and inspect manually first: df.info(), df.describe(), df.head(10) — write two to three observations before opening ChatGPT), Step 2 (Generate cleaning code with ChatGPT: schema + specific cleaning requirements prompt → review code line by line before running), Step 3 (Ask for statistical interpretation of patterns: describe findings to ChatGPT, receive starting point for your own reasoning), Step 4 (Generate summary narrative: provide observations, receive first draft, revise for accuracy and domain context), Step 5 (Document AI usage in portfolio: specify where AI was used and what was changed). Each step shows a specific output and a "your responsibility" marker distinguishing AI work from analyst judgment.
If you want to see exactly how AI tools integrate into a Data Analyst’s exploratory analysis workflow, this step-by-step session produces a complete EDA on any dataset using a combination of Python, Pandas, and ChatGPT assistance.
Step 1—Load and inspect the dataset manually first. Before opening ChatGPT, load the dataset in Pandas and run df.info(), df.describe(), and df.head(10) yourself. Write down two to three observations: what are the column types? Are there obvious missing values? What does one row represent? This two-minute step ensures you are not using AI to substitute for understanding your data you are using it to accelerate work you could do yourself.
Step 2—Generate the cleaning code with ChatGPT. Open ChatGPT and provide the dataset schema (column names and types) plus your specific cleaning requirements: “I have a dataset with these columns and types. There are approximately 15% missing values in the age column and 5% in the income column. Write Pandas code to handle the missing values in age using median imputation and drop rows where income is missing.” Review the generated code line by line before running it.
Step 3—Ask ChatGPT for statistical interpretation of key patterns. After running your EDA visualisations (distributions, correlation heatmap, pairplots), screenshot or describe the key patterns you see and ask ChatGPT: “My analysis shows a correlation of 0.72 between customer tenure and total spend, but the relationship appears to be driven almost entirely by customers over 5 years tenure. How should I interpret this and what follow-up analysis would you recommend?” Use the response as a starting point for your own reasoning, not as the conclusion itself.
Step 4—Generate the summary narrative. Once the EDA is complete, ask ChatGPT to draft a three-paragraph executive summary of the findings based on the observations you provide. Revise the draft to ensure accuracy and add domain context the model does not have. This is the section where AI genuinely saves time the first draft of analytical writing is the most friction-heavy part of the communication stage.
Step 5—Document the AI usage in your portfolio project. Note specifically where in the analysis you used AI assistance and what you changed from the AI-generated output. This documentation demonstrates analytical judgment the ability to use AI as a starting point and improve on it which is more valuable to an employer than demonstrating that you used the tool.
(Read more: )
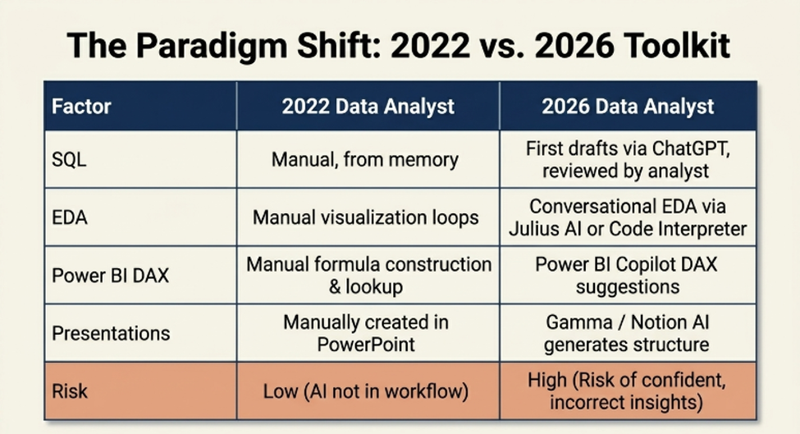
Data Analyst’s Toolkit: Then vs Now
A before-and-after comparison table showing how the Data Analyst toolkit has shifted — covering factors such as SQL query complexity tools (writing from memory vs AI-assisted drafting with review), EDA approach (manual Pandas loops vs conversational Julius AI/Code Interpreter), Power BI DAX creation (manual syntax reference vs Copilot DAX suggestion and narration), chart type selection (analyst judgment only vs Tableau AI recommendations with analyst refinement), stakeholder communication (manual PowerPoint vs Gamma deck generation), Python analysis code (written from scratch vs GitHub Copilot assisted), and the primary competency required for AI tools (technical skill only vs technical skill plus analytical judgment to verify output).
FAQs
Q1: What are the most important AI tools for a Data Analyst to learn in India in 2026?
The highest-impact AI tools for Data Analysts in India’s 2026 market are ChatGPT-4o or Claude for SQL query generation and Python data cleaning code, Microsoft Copilot inside Power BI for DAX generation and report narration, GitHub Copilot for Python analysis script development, and Julius AI for conversational exploratory data analysis. For stakeholder communication, Gamma accelerates converting analysis findings into presentation decks. Prioritise the tools that fit your primary tech stack: Power BI Copilot if Power BI is central to your role, ChatGPT for SQL and Python work across any stack.
Q2: Should Data Analyst freshers in India learn AI tools before getting a job in 2026? Yes, but in the right sequence. Build genuine proficiency in SQL, Power BI, Python with Pandas, and Excel first. Then layer in AI tool proficiency: using ChatGPT to accelerate query writing, Power BI Copilot for DAX suggestions, and Code Interpreter for EDA. Demonstrating AI-augmented analytical work in your portfolio projects signals both foundational competence and modern workflow awareness — the combination employers in India are beginning to seek.
Q3: Can ChatGPT replace SQL skills for a Data Analyst? No. ChatGPT generates SQL from natural language descriptions, but evaluating whether the generated query is logically correct — whether the joins are appropriate, whether the aggregation conditions match the business requirement, whether the query handles edge cases correctly — requires genuine SQL understanding. A Data Analyst who relies on ChatGPT for SQL without understanding SQL will ship incorrect queries with confident presentation. ChatGPT accelerates query writing for analysts who already know SQL; it does not substitute for learning SQL.
Q4: Is Power BI Copilot available for all Power BI users in India in 2026? Power BI Copilot requires Microsoft Fabric capacity or Power BI Premium Per User (PPU), which means it is available in enterprise environments with the appropriate Microsoft licensing. It is not available on the free Power BI Desktop or Power BI Pro tier. For freshers practising on their own, the Copilot features require an enterprise account. However, demonstrating knowledge of what Copilot does and how to use it is still a differentiating skill in interviews, as many hiring companies have the enterprise licensing in place.
Q5: Which AI tools for Data Analysts are the most overrated in 2026? Tools that generate automated insights from raw data without requiring the analyst to specify what they are looking for — the generic “AI finds patterns in your data” category — are the most frequently oversold. These tools can surface correlations and anomalies, but without the analyst’s domain knowledge and business context, many of the patterns they surface are either obvious, spurious, or unactionable. The AI tools that create genuine value are those that accelerate specific well-defined analyst tasks (SQL generation, code writing, DAX construction) rather than those that claim to automate the analytical thinking itself.
Q6: How does Itdaksh Education incorporate AI tools into its Data Analytics programme? Itdaksh Education’s Data Analytics programme introduces AI tools in the second half of the curriculum, after students have established genuine proficiency in SQL, Power BI, Python with Pandas, and Excel. The integration covers ChatGPT for SQL and Python code generation, Power BI Copilot for DAX and report narration, and the conversational EDA workflow using ChatGPT’s Code Interpreter. The curriculum is structured by Director Mrityunjay Pandey, who specifically designs the AI integration modules around the principle that tools amplify skill students learn to use AI as a productivity multiplier on work they understand, not as a substitute for the foundational competencies that make AI-generated output verifiable.
The highest-impact AI tools for Data Analysts in 2026 are ChatGPT-4o / Claude for SQL and Python code generation, GitHub Copilot for analysis scripts, Power BI Copilot for DAX and report narration, Tableau AI for natural language queries, and Julius AI for conversational EDA.
The DATA-6 Analyst Productivity Stack maps each tool to the specific stage in the analysis workflow where it creates the most leverage: cleaning, EDA, SQL, automated insights, visualisation, and stakeholder communication.
AI tools for Data Analysts require two competencies: the technical ability to use the tool effectively, and the analytical judgment to verify whether the output is correct and meaningful. Only the first is provided by the tool.
For job readiness in India in 2026, prioritise foundational proficiency first (SQL, Power BI, Python, Excel), then demonstrate AI-augmented workflow in portfolio projects. This combination is what employers are beginning to actively seek.
The contrarian truth: AI tools widen the gap between strong and weak Data Analysts. They accelerate correct analysis and accelerate incorrect analysis with equal confidence. The analyst’s judgment is the differentiator not the tool.
The five-step AI-assisted EDA workflow provides a practical, documentable pattern for integrating AI tools into analysis work in a way that demonstrates analytical judgment rather than just tool usage.
Power BI Copilot requires enterprise licensing (Microsoft Fabric or PPU), which limits direct practice but not the value of understanding and demonstrating knowledge of the capability.
Free Resources:
Download the Free Data Analyst AI Tools Integration Guide the DATA-6 Productivity Stack, the workflow-mapped tool comparison, the five-step AI-assisted EDA checklist, and the portfolio project documentation template for demonstrating AI-augmented analytical work. Used by Itdaksh Education’s Data Analytics students in Thane.
Data Analytics, Data Science with AI, Python Full Stack, Agentic AI.
Rated 4.9/5 on Google.
#AI tools Data Analysts India 2026
#DATA-6 Analyst Productivity Stack
#ChatGPT SQL Data Analyst
#Power BI Copilot India
# Julius AI EDA
#Tableau AI Data Analyst
#AI Data Analyst workflow India
# Itdaksh Education Data Analytics
#Mrityunjay Pandey
#AI analytical judgment

 Chat to Support